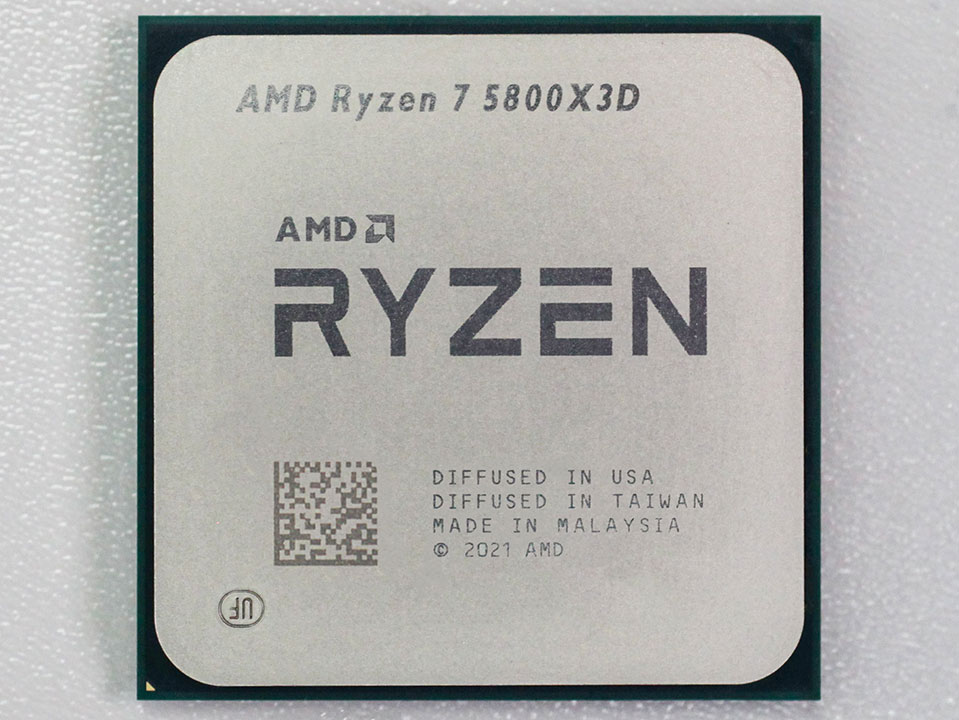
Second, behind the Core i9-12900KS, it has 720p and 1080p resolutions. It is in fifth place for 4K gaming.
After XanxoGaming, it’s TechPowerUp’s turn to make its verdict on the Ryzen 7 5800X3D, a few hours ago; In principle, the official date for lifting the ban is April 14. Remember that the processor will be marketed from April 20th. Our colleagues tested the Ryzen 5800X3D on a slew of games, in 720p, 1080p, 1440p and 2160p resolutions. The games are Battlefield V, Borderlands 3, Cyberpunk 2077, Doom Eternal, Far Cry 5, Metro Exodus, RDR2, and Shadow of the Tomb Raider. In contrast to the XanxoGaming test, TechPowerUp compares the performance of the Ryzen 7 5800X3D to that of several other processors, including its direct predecessor, the Ryzen 7 5800X.

To make their measurements, W1zzard installed all of the Ryzen Zen 3 on an MSI MPG X570 Gaming Plus motherboard; The Ryzen 7 5800X3D takes advantage of the AGESA 1.2.0.6c BIOS which is supposed to take full advantage of it. On the RAM side, there is 2 x 16 GB of DDR4-3600. Alder Lake processors are powered by the ASUS Z690 Maximus Hero motherboard and are powered by 2 x 16GB DDR5-6000 memory. The Rocket Lake chips are powered by the ASUS Z590 Maximus XIII Hero motherboard and paired with 2 x 16GB DDR4-3600 memory. Finally, Comet Lake is powered by an ASUS Z490 Maximus XII Extreme motherboard that’s still equipped with 2×16GB of DDR4-3600.
All processors are cooled by the Arctic Liquid Freezer II 360mm AIO range. The systems run on Windows 11 64-bit. The graphics card used is an EVGA GeForce RTX 3080 FTW3 Ultra.
Results
At 1080p, the Ryzen 7 5800X3D is sandwiched between the Core i9-12900K and Core i9-12900KS. It beats the Ryzen 7 5800X by 7.7 points. At 1440p, the Ryzen 7 5800X3D is at the top of the rankings. Expands 6.4 points gap with Ryzen 7 5800X.
For completeness, note that at 720p, the processor with AMD’s 3D V-Cache is on par with the Core i9-12900K and 1.9 points behind the Core i9-12900KS (101.9%). The Ryzen 7 5800X has a relative performance of 89.4%.
Gaps are minimal at 2160 pixels. The Ryzen 7 5800X3D was beaten by Core i5-12600K and Core i7-12700K, both with 100.3%, Core i9-12900K/KS with 100.7% and 100.9%, respectively. The Ryzen 7 5800X has a score of 98.7%.
As W1zzard, the file’s author, points out, differences in performance vary greatly by game. For example, at 720p, the Ryzen 7 5800X3D outperforms its counterpart by 10.6 points on average, but by 43 points in a game like Borderlands 3. In this title, the chip delivers 139 frames per second on average at 720p, versus 120.2 fps for the Core i9 -12900KS and 96.6 IPS for the Ryzen 7 5800X. This hierarchy is found at 1080p resolution, with an average of 138.5 IPS for the Ryzen 7 5800X3D, 120.6 IPS for the Core i9-12900KS and 96.7 IPS for the Ryzen 7 5800X.
Energy Efficiency
A few words about consumption to the end. In one core, the Ryzen 7 5800X3D has the same Ryzen 7 5800X consumption: 76W for the entire system. It’s less greedy in multicore on Cinebench, with 166 watts versus 175 watts, and still for a full PC. The Prime 95 stress test indicates a consumption of 176 watts for the Ryzen 7 5800X3D, 158 watts for the Ryzen 7 5800X.
Overall, with a single-core power efficiency of 12.8 kJ, the Ryzen 7 5800X3D is the second best performing, behind the Ryzen 7 5800X (12.7 kJ). On the other hand, with 10.5 kJ instead of 10 kJ in the multi-core, the Ryzen 7 5800X3D leaves the best places in this category to position itself in the middle of the pack, between the Core i9-12900K and Core i9-12900KS.
Feel free to refer to the file TechPowerUp To discover the full scores for each game in each definition.

“Tv geek. Certified beer fanatic. Extreme zombie fan. Web aficionado. Food nerd. Coffee junkie.”


