

- In complex railway design projects in Scandinavia, the use of virtual reality (VR), geographic information system (GIS) and automation has been effective.
- Virtual reality and augmented reality (AR) experiences have reassured the audience.
- Tools help reduce errors, improve coordination, and save time.
Throughout his career, Mantas Smedtas has been a technology leader at an international engineering, design and consulting firm RambollHe has learned important lessons about how to allay private concerns when developing railway projects, such as the Norwegian National Railways' Hensetting-Østfoldbanen extension. There is light.
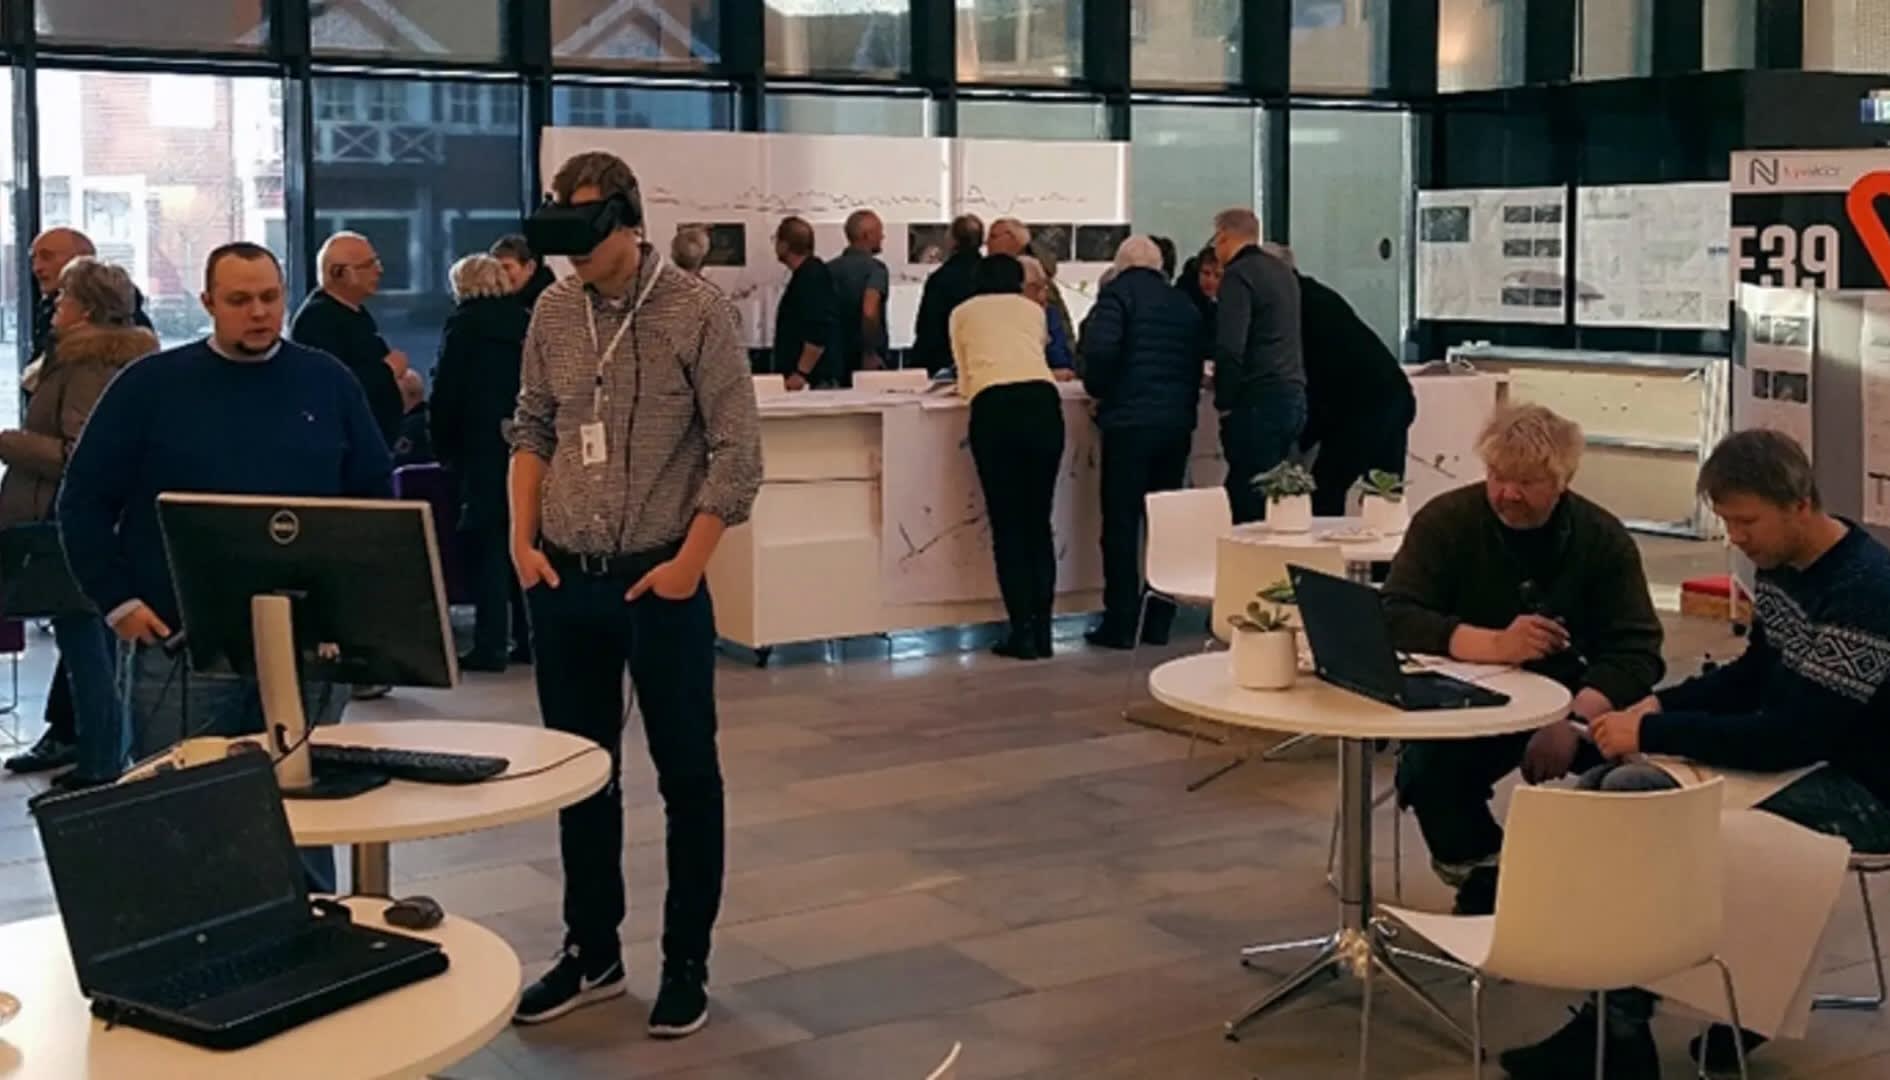
At a public meeting, a resident expressed concern about the proximity of his home to an area where landscape architects were building a large noise barrier. On the 2D map, the barrier looked huge. “It's actually a mountain,” says Mr. Smedtas. “We put VR goggles on him and he realized he couldn't see them at all because of the trees.” Despite the man's initial skepticism, seeing the barrier using VR eased his fears.
Ramboll, founded in Denmark in 1945, uses several digital technologies to address the many challenges facing urban rail design projects. This could include engaging audiences in virtual reality and augmented reality (AR) experiences or using geographic information system (GIS) data to accelerate design.
Virtual reality has proven to be a powerful tool for engaging communities Local: “We present a rough draft to community meetings,” explains Mr. Smedtas. “We have a model on the screen on the wall and virtual reality goggles ready to use, so participants can watch from different perspectives.”
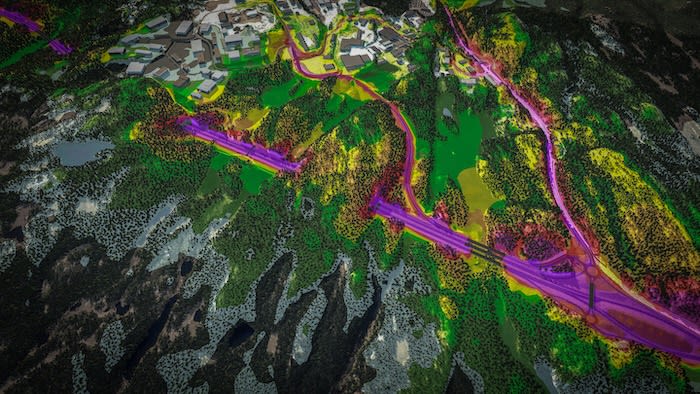
GIS provides an accurate overview of data related to infrastructure, buildings, water, soil conditions and vegetation, enabling design in a real-world context. For Ramboll, linking this data to a digital map helps discover geographic connections in the data, leading to better results and enhanced knowledge sharing.
Ramboll uses the platform ArcGIS Online toEsri (Environmental Systems Research Institute) with its offices in 35 countries. Staff can extract GIS data from any area to create detailed, multi-layer maps with a resolution of up to 20 cm. Add GIS data layers to smart models using digital modeling (Bim) Ramboll helps reduce margins of error in design projects such as Bane NOR railways, thus significantly reducing risks. (The company uses Autodesk Connector for ArcGIS to connect GIS data to digital design models.)
GIS tools improve communication at every stage and help project teams plan optimal solutions to problems such as urban sprawl and environmental encroachment. The 3D map of the Hensetting-Østfoldbanen project site included data on 35,000 trees, which was an important discussion point with residents. Information on tree classification, height, radius, density and proximity to houses made it possible to plan effective sound barriers along the railway line, while preserving the natural habitat.
Railway track design becomes more efficient
To design the Hensetting-Østfoldbanen project, which includes 2.2 kilometers of railway lines and two railway depots, Ramboll took an “innovative approach”. Four components of the system, catenary, rail, signals and noise walls, are integrated for the first time, with a focus on automation and data.
The railway project is complicated by the population density in and around the major cities, where more than 80% of Norwegians live. a growth The normal population of 0.5% to 1% adds an additional 50,000 people per year. By creating a safe and accurate passenger and freight system, Bane NOR aims to provide as much railway value as possible for the money invested.
Ramboll divided the project into four main interconnected parts: parametric content creation, modeling automation, design review and data visualization using Autodesk Dynamo Studio, Inventor, Revit, Infraworks, BIM360 documentation, formation And Civil 3D.
Working under tight deadlines, the team designed the early stages of the project in parallel with the later stages. It has been difficult to find enough talent across disciplines (chain, rail, road, bridge, signal) who can quickly adopt more efficient workflows and tools.
Visualizing and aggregating data has dramatically improved design efficiency and customer experience. An intuitive interactive dashboard allows teams to evaluate progress, analyze designs, and receive contextual feedback through graph and data models.
Data collection improves communication
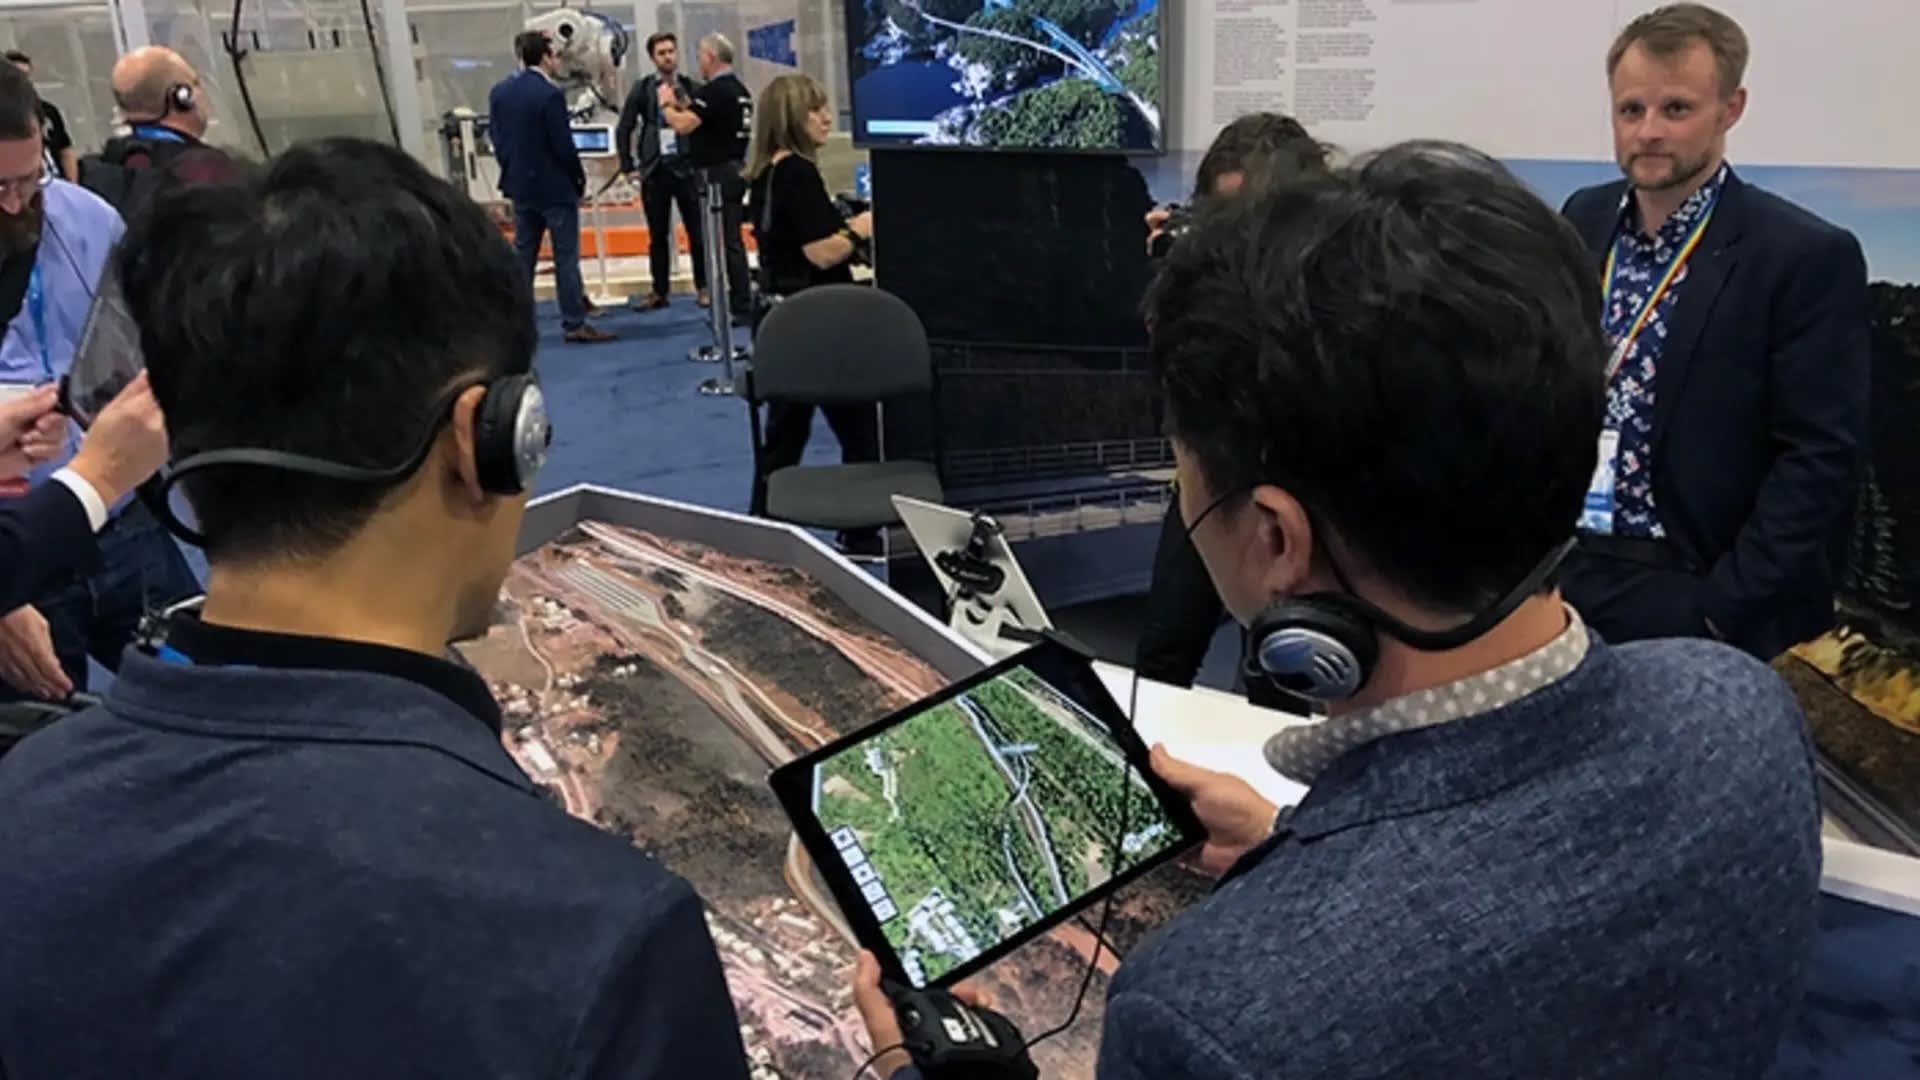
Ramboll's data-rich design environment collects data from many sources. To help clients visualize design options, the team created interactive, immersive experiences using the software lonliness, then export the data to RealVideo (RVX) and Filmbox (FBX) file formats. “We use the built-in VR tool, but we also export the data to RVX using Unity, create VR models and deliver them to the client in open source format,” Smedtas explains.
This process ensured interoperability with parametric content creation applications such as InfraWorks. “Thanks to the solution we developed, we were able to collect data from Revit, Dynamo Studio and Civil 3D and add it to InfraWorks with all its metadata,” explains Smedtas. “We use it to communicate with clients. When it became a design review tool, we developed an application programming interface (API). [interface de programmation d’applications] To enter data BIM 360where it is ready to open in the Forge.
Interactive control panel powered by Powerby Microsoft displayed metrics that helped the team evaluate progress, analyze KPIs, and get contextual feedback. “The design review tool was a proof of concept for us,” Smedtas says. “Having more data in one place allows decisions to be made much faster. If I could get more information, I would, especially when we have open access to it and can avoid more errors.”
Workflow automation reduces design hours
Ramboll has designed workflows that can be scaled as projects grow from five to a dozen or more specializations. Based on parametric design models, project teams can integrate all workflows into a digital platform that automates many manual tasks.
This automation increases productivity, but requires high-quality content to get reliable results. The Revit library for the railway project provided three levels of detail: low, medium, and high. Team members can choose the desired resolution.
The team responsible for designing the electrical cables for the electrified line was an example of an accelerated and automated workflow. The team claims to have saved 440 design hours by working 2.2 times faster using the Revit library. “Now that we have a really good library in Revit, we can build these strings seven times faster, if not faster,” Smedtas says.
Automation saves time, but Smedtas believes communication is key to better planning, better design, and better results. It's not just about talking to other people. “This means better communication between Ramboll and customers, between Ramboll and software developers and between software products.”
For the Hensetting-Østfoldbanen project, communication helped improve the design process and make it more efficient, integrating clients into the workflow more quickly. “This project is not about saving time,” says Mr. Smedtas. We say: “We can offer you better quality at the same time”.

Sylvia Plath is a contributor at TechNewsInc, covering news, politics, business, technology, sports, entertainment, and lifestyle. She focuses on delivering clear, accurate reporting and useful information on current affairs, helping readers stay informed through relevant stories, emerging trends, and developments that matter to a broad audience.


